Daily Alpha Brief — 2026-08-31 — BEAR regime across majors
Bayesian crypto brief for 2026-08-31: BEAR regime, strategy performance, weight shifts, and quant-vs-crowd sentiment across 9 symbols.
TL;DR
- Dominant regime: BEAR (4 bullish / 5 bearish of 9 symbols).
- Top signal: rsi_macd on XRP cut 0.244 (0.50 → 0.26).
- Shadow portfolio: $732 (-26.79%), 1 open, 35% win rate.
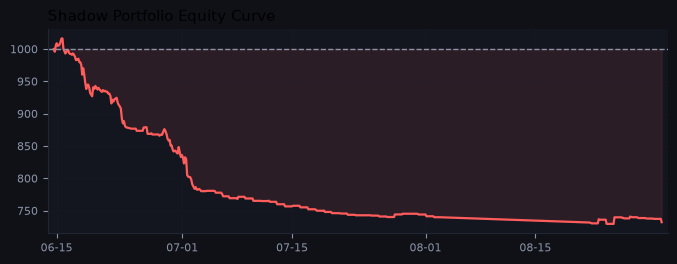 Shadow portfolio value since inception (dashed line = $1,000 starting capital).
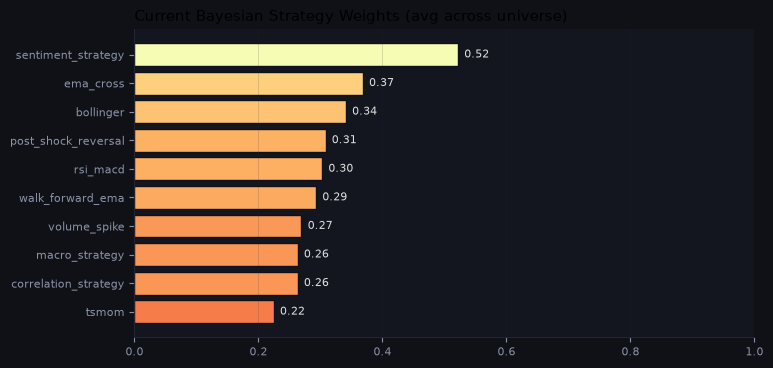 Current Bayesian reliability weights, averaged across the universe.
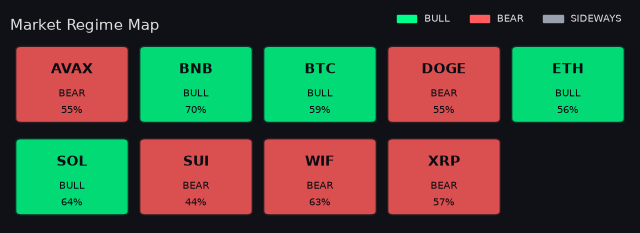 Detected regime per symbol (EMA200 + ADX); % = lead-strategy conviction.
🌐 Market Indices
| Fear & Greed | BTC Dominance | Total Market Cap | 24h Volume |
|---|---|---|---|
| 73/100 — Greed | 59.7% (balanced) | $2.61T (-0.91%) | $63B |
Crowd reads greed at 73/100; BTC dominance 59.7% signals balanced.
🌐 Market Overview
Economic (FRED):
| Yield Curve | Fed Rate | M2 YoY |
|---|---|---|
| 🟡 +0.39% (Flat) | 3.63% | +5.4% |
Stablecoin dominance 9.8% (risk-on); yield curve regime Flat.
Funding Rates (contrarian — heavy positive = crowded longs to fade):
| BTC | ETH | SOL | Top Mover |
|---|---|---|---|
| +0.007% | +0.001% | -0.013% | BTC (+0.007%, balanced) |
Economic Calendar: Next FOMC: in 16 days | Next CPI: in 11 days | position-size modifier 1.00×.
📊 Regime Analysis
Regime per symbol from EMA200 + ADX on daily candles, with the fusion signal.
| Symbol | Regime | Signal |
|---|---|---|
| AVAX/USDT | BEAR | WATCH |
| BNB/USDT | BULL | EXECUTE |
| BTC/USDT | BULL | WATCH |
| DOGE/USDT | BEAR | WATCH |
| ETH/USDT | BULL | WATCH |
| SOL/USDT | BULL | EXECUTE |
| SUI/USDT | BEAR | WATCH |
| WIF/USDT | BEAR | EXECUTE |
| XRP/USDT | BEAR | WATCH |
The book is broadly bearish: 4 BULL / 5 BEAR of 9 symbols.
🔗 Correlation Signals
Stable pairs (r > 0.70): DOGE/SUI: r=0.89 ✅ | SUI/AVAX: r=0.89 ✅ | XRP/DOGE: r=0.88 ✅ | XRP/SUI: r=0.87 ✅ | DOGE/AVAX: r=0.87 ✅ | BTC/ETH: r=0.87 ✅
Index signals: BTC dominance NEUTRAL → no rotation; Fear & Greed contrarian NONE.
⚙️ Strategy Performance
Aggregate 7-day performance per strategy (replayed across the universe). Edge = win-rate × avg P&L per trade — the table is sorted by it.
| Strategy | Avg P&L / trade | Win Rate | Avg Sharpe | Edge | Trades |
|---|---|---|---|---|---|
| bollinger | +4.25 | 36% | 0.48 | +1.53 | 245 |
| sentiment_strategy | +0.00 | 0% | 0.00 | +0.00 | 0 |
| correlation_strategy | +0.00 | 0% | 0.00 | +0.00 | 0 |
| macro_strategy | +0.00 | 0% | 0.00 | +0.00 | 0 |
| post_shock_reversal | -1.25 | 29% | -0.69 | -0.37 | 429 |
| volume_spike | -2.41 | 28% | -4.60 | -0.67 | 538 |
| ema_cross | -2.57 | 34% | -0.28 | -0.87 | 189 |
| walk_forward_ema | -5.97 | 30% | -3.10 | -1.78 | 164 |
| rsi_macd | -5.62 | 32% | -4.50 | -1.81 | 177 |
| tsmom | -14.21 | 19% | -6.56 | -2.71 | 42 |
All P&L figures normalized to a 100 USDT position size for comparability (not summed across symbols).
🧠 Bayesian Weight Shifts
| Symbol | Top mover | Weight Δ | Lead strategy (conf) |
|---|---|---|---|
| XRP/USDT | rsi_macd | -0.244 | sentiment_strategy (57%) |
| BTC/USDT | bollinger | -0.231 | sentiment_strategy (59%) |
| SOL/USDT | rsi_macd | -0.230 | bollinger (64%) |
XRP/USDT (BEAR):
rsi_macd is the clearest cut: 7d win-rate of 23% (rule 2) with a catastrophic Sharpe of -10.19 and -801 pnl drives it down to 0.20; volume_spike similarly posts 28% win-rate and -7.34 Sharpe over 50 trades, warranting a deep cut to 0.15. Bollinger is the standout with 7d Sharpe of 4.33 and +310 pnl over 50 trades (rule 4), and though the 24h print is ugly its weekly consistency justifies holding close to current weight at 0.58; in a BEAR regime mean-reversion receives a modest regime boost. ema_cross and walk_forward_ema both show negative 7d Sharpe and losses despite a good 24h fluke (rule 6 conflict: data overrides regime momentum prior), so both are trimmed; tsmom has zero trades (rule 1, held near current); post_shock_reversal has 7d Sharpe of -0.72 with negative pnl so a small cut applies; sentiment_strategy holds near current on thin but 100%-confluent 7d coverage with near-zero composite, warranting slight caution; correlation_strategy and macro_strategy have no trades and stay near current weight.
BTC/USDT (BULL):
Nearly every price-based strategy is deeply unprofitable on 7d with large negative Sharpes, triggering rules 2-3 across the board: rsi_macd (7d 0% win, Sharpe -11.99), volume_spike (31% win, Sharpe -7.98, pnl -211), post_shock_reversal (31% win, Sharpe -4.16, pnl -187), and walk_forward_ema (32% win, Sharpe -2.06) are all cut hard; tsmom has only 2 7d trades so rule 1 caps movement near current but negative Sharpe warrants a modest cut. Bollinger is a BULL-regime underperformer with 31% win and Sharpe -3.23 (band-walk casualty), so it is cut significantly despite some regime-multiplier support; ema_cross has the best relative 24h showing (50% win, Sharpe 3.81) but its 7d Sharpe of -1.31 on 36 trades still signals rule 3 — I hold it closest to neutral among price strategies while acknowledging the 7d data wins over the single-day print. Sentiment_strategy had 7d coverage of 3 sources with 100% confluence and a mildly positive composite, justifying a modest hold near current; correlation_strategy and macro_strategy report zero signals on both windows, so they are held at their current weights per the no-signal guidance.
SOL/USDT (BULL):
Bollinger is the standout performer with 7d Sharpe of 13.22 and +1013 pnl despite a BULL regime where mean-reversion is disfavoured — the data overwhelmingly overrides the regime prior (rule 4/6), so it earns the largest boost toward 0.80. rsi_macd has a negative 7d Sharpe and win-rate below 35% despite being momentum-aligned with the BULL regime, so it is cut significantly from its inflated 0.718 (rule 3 conflict); ema_cross, volume_spike, walk_forward_ema, and tsmom all show deeply negative 7d Sharpe and pnl with win-rates well below 30%, warranting cuts toward 0.10-0.18 per rules 2-3. post_shock_reversal keeps a moderate weight at 0.45 given its positive 7d Sharpe (2.48) and pnl (+207), though 24h deterioration prevents a full raise; sentiment_strategy is held near neutral at 0.50 given 24h source coverage of zero and only a near-zero avg_composite on 7d, while correlation_strategy and macro_strategy both report zero trades across all windows and are held near their current weights per the sparse-data guidance.
📡 Signal Outlook
| Symbol | Decision | Confidence | Lead | Confluence |
|---|---|---|---|---|
| AVAX/USDT | WATCH | 55% | sentiment_strategy (0.55) | — |
| BNB/USDT | EXECUTE | 70% | walk_forward_ema (0.70) | — |
| BTC/USDT | WATCH | 59% | sentiment_strategy (0.59) | — |
| DOGE/USDT | WATCH | 55% | sentiment_strategy (0.55) | — |
| ETH/USDT | WATCH | 56% | sentiment_strategy (0.56) | — |
| SOL/USDT | EXECUTE | 64% | bollinger (0.64) | — |
| SUI/USDT | WATCH | 44% | sentiment_strategy (0.44) | — |
| WIF/USDT | EXECUTE | 63% | volume_spike (0.63) | — |
| XRP/USDT | WATCH | 57% | sentiment_strategy (0.57) | — |
💼 Shadow Portfolio
| Metric | Value |
|---|---|
| Total Value | $732.08 |
| P&L since 2026-06-14 | -267.92 (-26.79%) |
| vs BTC Buy&Hold | -44.84% (B&H +18.05%) |
| vs ETH Buy&Hold | -66.51% (B&H +39.72%) |
| Open Positions | 1 |
| Win Rate | 35.0% (1536 closed) |
Open positions:
| Symbol | Side | Entry | Mark | Unreal. P&L |
|---|---|---|---|---|
| DOGE/USDT | short | 0.08213 | 0.08155 | +1.04 |
$1,000 USDT paper portfolio, 1% risk/trade, MEXC fees modelled. No real capital is deployed.
📡 Discourse Radar
Sentiment analysis pipeline launching soon.
📈 System Architecture
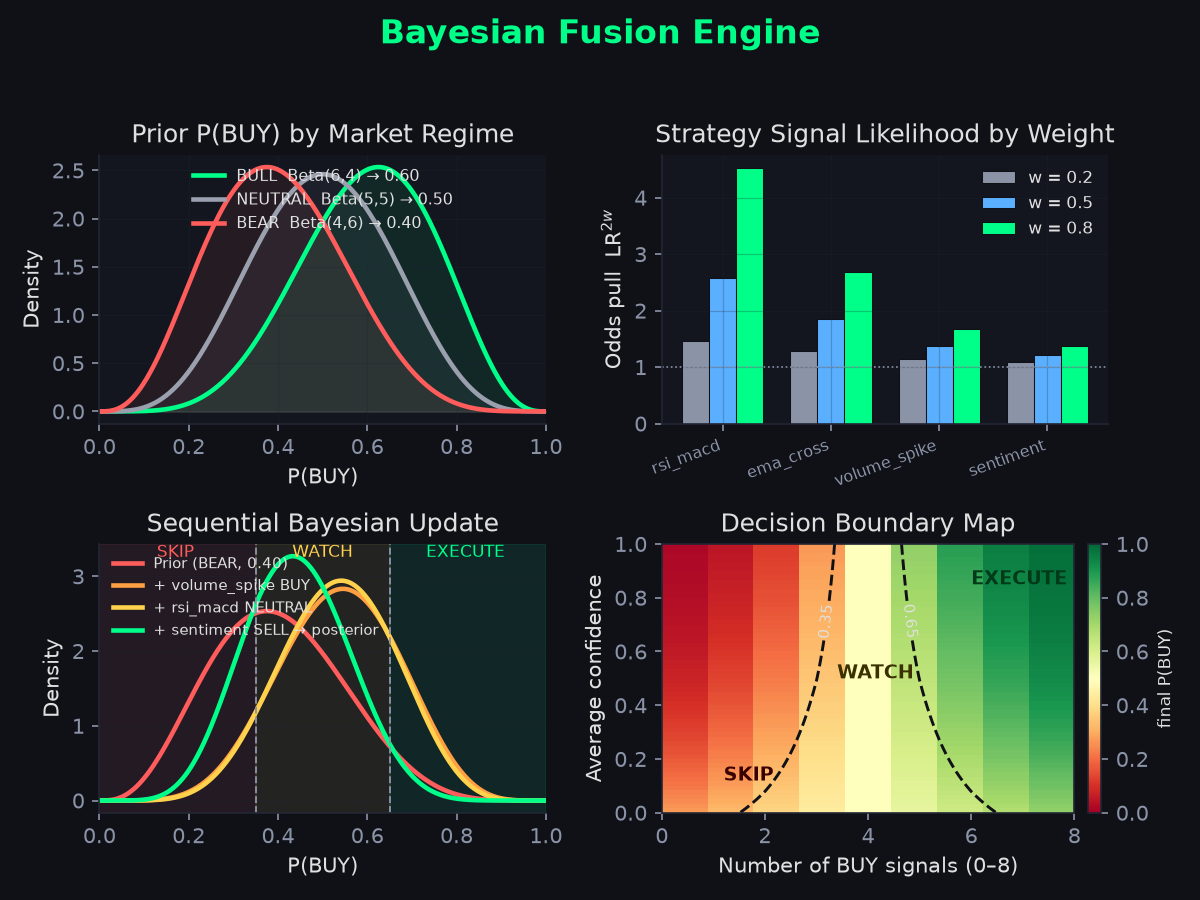 The four-panel Bayesian fusion engine behind these daily decisions (shown Mondays). See Methodology.
Academic Footnote
Fang et al. (2020) — a survey of cryptocurrency trading strategies.
Disclaimer
This is algorithmic analysis only, not financial advice.