Daily Alpha Brief — 2026-08-30 — BULL regime across majors
Bayesian crypto brief for 2026-08-30: BULL regime, strategy performance, weight shifts, and quant-vs-crowd sentiment across 9 symbols.
TL;DR
- Dominant regime: BULL (5 bullish / 4 bearish of 9 symbols).
- Top signal: walk_forward_ema on WIF cut 0.220 (0.52 → 0.30).
- Shadow portfolio: $737 (-26.28%), 0 open, 35% win rate.
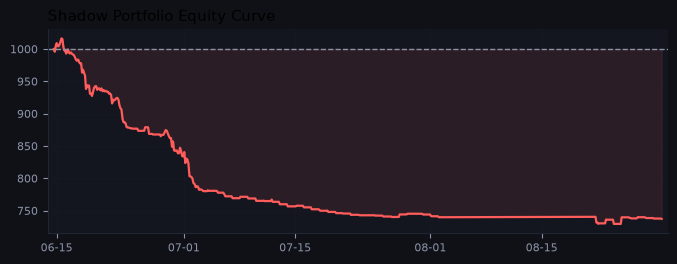 Shadow portfolio value since inception (dashed line = $1,000 starting capital).
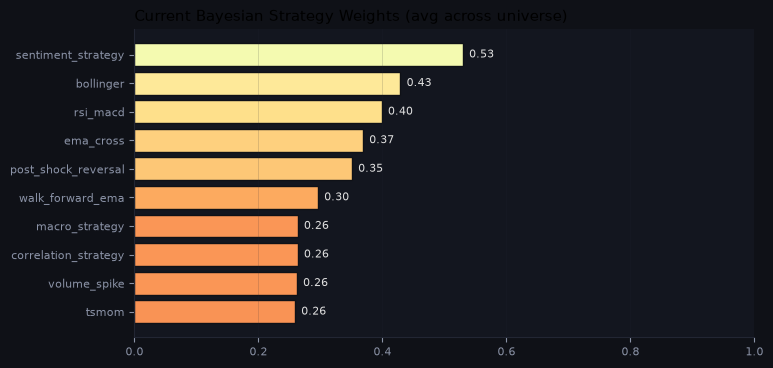 Current Bayesian reliability weights, averaged across the universe.
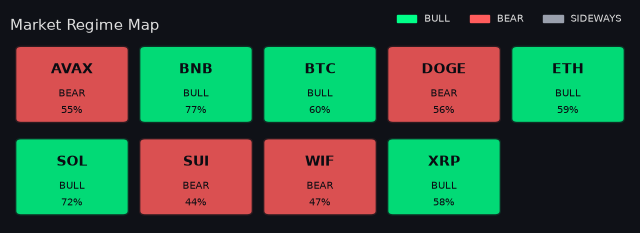 Detected regime per symbol (EMA200 + ADX); % = lead-strategy conviction.
🌐 Market Indices
| Fear & Greed | BTC Dominance | Total Market Cap | 24h Volume |
|---|---|---|---|
| 77/100 — Greed | 59.6% (balanced) | $2.64T (+0.85%) | $47B |
Crowd reads greed at 77/100; BTC dominance 59.6% signals balanced.
🌐 Market Overview
Economic (FRED):
| Yield Curve | Fed Rate | M2 YoY |
|---|---|---|
| 🟡 +0.47% (Flat) | 3.63% | +5.4% |
Stablecoin dominance 9.7% (risk-on); yield curve regime Flat.
Funding Rates (contrarian — heavy positive = crowded longs to fade):
| BTC | ETH | SOL | Top Mover |
|---|---|---|---|
| +0.008% | +0.001% | -0.013% | BTC (+0.008%, balanced) |
Economic Calendar: Next FOMC: in 17 days | Next CPI: in 12 days | position-size modifier 1.00×.
📊 Regime Analysis
Regime per symbol from EMA200 + ADX on daily candles, with the fusion signal.
| Symbol | Regime | Signal |
|---|---|---|
| AVAX/USDT | BEAR | WATCH |
| BNB/USDT | BULL | EXECUTE |
| BTC/USDT | BULL | EXECUTE |
| DOGE/USDT | BEAR | WATCH |
| ETH/USDT | BULL | WATCH |
| SOL/USDT | BULL | EXECUTE |
| SUI/USDT | BEAR | WATCH |
| WIF/USDT | BEAR | WATCH |
| XRP/USDT | BULL | WATCH |
The book is broadly bullish: 5 BULL / 4 BEAR of 9 symbols.
🔗 Correlation Signals
Stable pairs (r > 0.70): SUI/AVAX: r=0.91 ✅ | DOGE/SUI: r=0.89 ✅ | XRP/SUI: r=0.89 ✅ | DOGE/AVAX: r=0.89 ✅ | XRP/DOGE: r=0.88 ✅ | BTC/ETH: r=0.87 ✅
Index signals: BTC dominance NEUTRAL → no rotation; Fear & Greed contrarian NONE.
⚙️ Strategy Performance
Aggregate 7-day performance per strategy (replayed across the universe). Edge = win-rate × avg P&L per trade — the table is sorted by it.
| Strategy | Avg P&L / trade | Win Rate | Avg Sharpe | Edge | Trades |
|---|---|---|---|---|---|
| bollinger | +13.08 | 43% | 7.14 | +5.59 | 220 |
| post_shock_reversal | +2.04 | 32% | 2.05 | +0.66 | 374 |
| rsi_macd | +1.57 | 38% | 1.73 | +0.59 | 130 |
| sentiment_strategy | +0.00 | 0% | 0.00 | +0.00 | 0 |
| correlation_strategy | +0.00 | 0% | 0.00 | +0.00 | 0 |
| macro_strategy | +0.00 | 0% | 0.00 | +0.00 | 0 |
| ema_cross | -2.63 | 34% | -0.79 | -0.88 | 188 |
| volume_spike | -5.00 | 27% | -5.64 | -1.33 | 557 |
| walk_forward_ema | -5.31 | 30% | -3.83 | -1.61 | 178 |
| tsmom | -11.29 | 20% | -7.16 | -2.20 | 41 |
All P&L figures normalized to a 100 USDT position size for comparability (not summed across symbols).
🧠 Bayesian Weight Shifts
| Symbol | Top mover | Weight Δ | Lead strategy (conf) |
|---|---|---|---|
| WIF/USDT | walk_forward_ema | -0.220 | ema_cross (47%) |
| BNB/USDT | ema_cross | -0.203 | rsi_macd (77%) |
| ETH/USDT | rsi_macd | +0.160 | bollinger (59%) |
WIF/USDT (BEAR):
rsi_macd and tsmom have zero 7d trades (rule 1), so both are held within +/-0.05 of their current weights near 0.25. ema_cross has only 3 7d trades but its metrics are exceptional (67% win, 7.04 Sharpe, +198 pnl); rule 1 caps the move to +/-0.05, giving a nudge to 0.46, also supported by BEAR regime favouring trend-followers. walk_forward_ema is cut from 0.516 to 0.38 per rule 3 (7d Sharpe -0.99, negative pnl) and the conflict rule — it is a momentum strategy losing money even in a BEAR trend. volume_spike keeps a modest hold near 0.52 despite alarming 24h metrics (-32.74 Sharpe, 8% win) because the 7d window dominates and shows +1205 pnl / 31% win, though the 24h deterioration warrants no further raise; post_shock_reversal is nudged slightly down from 0.191 to 0.18 given both 24h and 7d win-rates below 40% and negative 24h pnl, consistent with BEAR regime disfavouring mean-reversion. sentiment_strategy has near-zero composite and only 2 sources with no 24h data, so it is held close to current at 0.42. correlation_strategy and macro_strategy show zero activity and are held within +/-0.05 of their current 0.263.
BNB/USDT (BULL):
tsmom is the clearest casualty: 7d win-rate of 17% with a Sharpe of -10.69 and pnl of -237 fires rules 2-3 hard, so it is cut to 0.10 despite the BULL regime — a direct conflict-rule override (rule 6). volume_spike also shows persistent 7d underperformance (33% win, negative Sharpe -1.57, -70 pnl), so it is reduced to 0.18 per rules 2-3. rsi_macd has a strong 7d Sharpe (3.78) but only 41% win-rate, falling short of rule 4’s 55% threshold, so it is trimmed modestly from its elevated 0.629 to 0.55; ema_cross and walk_forward_ema both show positive 7d Sharpe and pnl and are momentum-aligned to BULL, earning measured raises to 0.72 and 0.70 respectively, while bollinger stays near its low floor given negative mean-reversion conditions in a trending market. Sentiment is held near neutral (0.47) given zero 24h sources and a near-zero composite signal, per the sparse-data guidance; correlation and macro strategies have no signal data and are held at their current weights unchanged.
ETH/USDT (BULL):
volume_spike is the clearest loser: 7d win-rate 30%, Sharpe -5.53, pnl -291.74 — persistent underperformance across both windows triggers rule 2/3 and a cut toward 0.10. ema_cross and walk_forward_ema both show negative 7d Sharpe and negative pnl in what should be a favourable BULL regime (rule 6 conflict: momentum strategies losing money despite the trend prior), so both are reduced rather than boosted. rsi_macd has an anomalously high 7d Sharpe (2.46) on only 13 trades with a 31% win-rate — the Sharpe likely reflects a few outsized wins masking poor hit-rate, so a modest nudge upward is warranted but not a large raise; bollinger’s 7d metrics are genuinely strong (46% win, Sharpe 11.73, +576 pnl) but the Sharpe magnitude is implausibly extreme (likely a scaling artefact), so it earns a small reduction from its current 0.560 rather than a boost, keeping it elevated but tempered; sentiment_strategy holds near current on decent 7d coverage (3 sources, 100% confluence) but near-zero composite signal limits any raise; tsmom, correlation_strategy, and macro_strategy have zero trades and are held close to their current weights per rule 1.
📡 Signal Outlook
| Symbol | Decision | Confidence | Lead | Confluence |
|---|---|---|---|---|
| AVAX/USDT | WATCH | 55% | sentiment_strategy (0.55) | — |
| BNB/USDT | EXECUTE | 77% | rsi_macd (0.77) | — |
| BTC/USDT | EXECUTE | 60% | sentiment_strategy (0.60) | — |
| DOGE/USDT | WATCH | 56% | sentiment_strategy (0.56) | — |
| ETH/USDT | WATCH | 59% | bollinger (0.59) | — |
| SOL/USDT | EXECUTE | 72% | rsi_macd (0.72) | — |
| SUI/USDT | WATCH | 44% | sentiment_strategy (0.44) | — |
| WIF/USDT | WATCH | 47% | ema_cross (0.47) | — |
| XRP/USDT | WATCH | 58% | sentiment_strategy (0.58) | — |
💼 Shadow Portfolio
| Metric | Value |
|---|---|
| Total Value | $737.21 |
| P&L since 2026-06-14 | -262.79 (-26.28%) |
| vs BTC Buy&Hold | -45.04% (B&H +18.76%) |
| vs ETH Buy&Hold | -68.59% (B&H +42.31%) |
| Open Positions | 0 |
| Win Rate | 35.0% (1531 closed) |
$1,000 USDT paper portfolio, 1% risk/trade, MEXC fees modelled. No real capital is deployed.
📡 Discourse Radar
Sentiment analysis pipeline launching soon.
Academic Footnote
Borgards (2021) — momentum and the cross-section of crypto returns.
Disclaimer
This is algorithmic analysis only, not financial advice.